

Gold's central case for 2026 sits in a $4,600 to $5,100 per ounce range, with a plausible upside toward $6,000 if the Federal Reserve cuts rates faster than expected and a downside risk to roughly $3,500 if the Fed turns hawkish. The single biggest swing factor is Fed policy and real yields. When rate-cut odds firm up, gold tends to rally; when the Fed signals patience, prices stall or retreat.
That range isn't a guess. It reflects the spread across major institutional forecasts published through mid-2026, and it comes with real volatility already on the books this year:
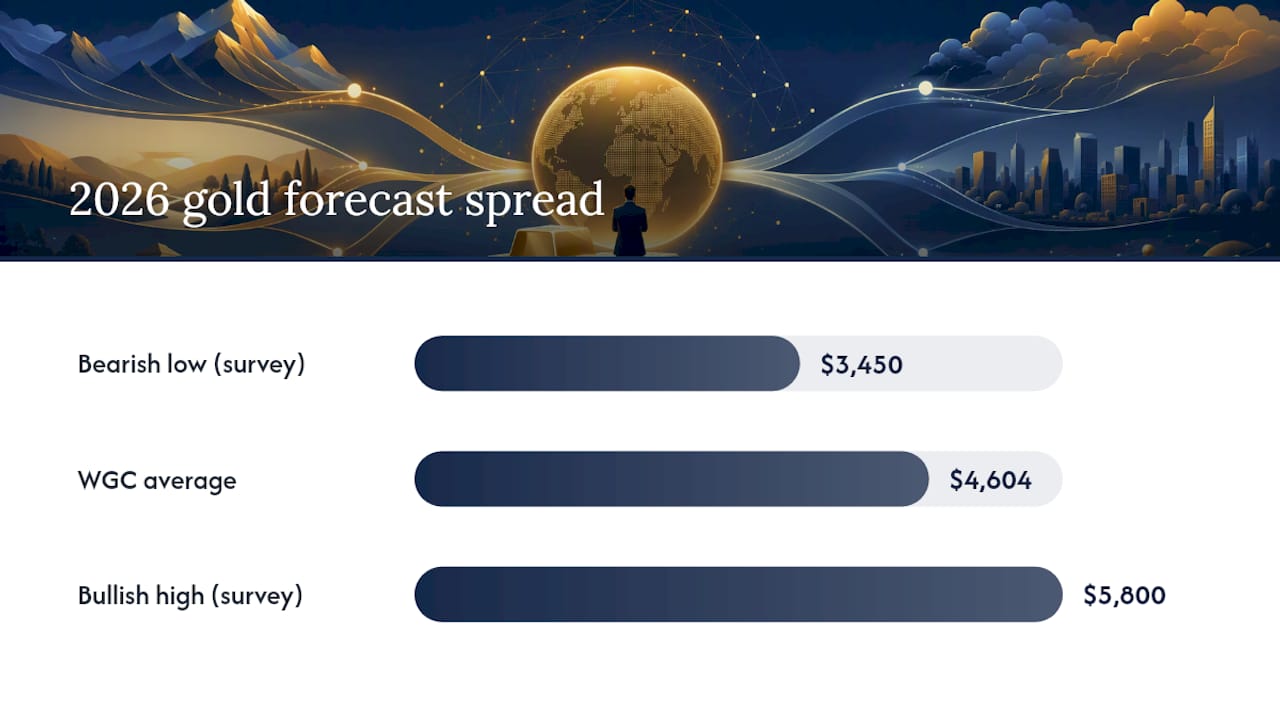
- Consensus range: Roughly $4,600 average with highs near $5,800 and lows near $3,450 across major analyst polls (see the consensus forecasts section below)
- Primary risk: A hawkish Fed shift that keeps real yields elevated and the dollar firm (see drivers and scenarios sections below)
- Where to act: Investors weighing allocation size, timing, or Gold IRA structure should jump to the investor implications section for concrete steps
Key Takeaways
Gold's 2026 outlook centers on a $4,600 to $5,100 base case, with Fed policy and real yields determining whether prices break toward $6,000 or retreat toward $3,500.
| Point | Details |
|---|---|
| Central 2026 range | Most institutional forecasts cluster around $4,600 to $5,100, with a wide spread from $3,450 to $5,800 across surveyed analysts. |
| Fed policy is the swing factor | Rate-cut timing and real yields drive short-term direction more than any other single variable this year. |
| Resistance near $4,500–$4,900 | This zone has capped rallies repeatedly, tied to investors selling near their January entry points. |
| Structural demand floor | Central bank buying and Asian regional demand cushion prices even during Western ETF outflows. |
| Convert outlook into action | Goldiraguide offers personalized provider matching, fee transparency, and independent reviews to help investors size a Gold IRA allocation. |
Table of Contents
- Gold Price Outlook 2026: Where Prices Stand Right Now
- What Are Analysts Forecasting for Gold in 2026?
- What Macro Forces Actually Move Gold Prices?
- Bull, Bear, or Neutral: Which Gold Scenario Is Most Likely?
- What Technical Levels Are Traders Watching in 2026?
- What Should Investors Do With This Gold Outlook?
- What Do GoldIRAGuide's Ongoing Reports Show?
- Will New Mining Technology Change Gold Supply in 2026?
- How Does Gold Compare to Other Safe-Haven Assets in 2026?
- What Could Derail the 2026 Gold Outlook?
- A Practical Read on Gold's 2026 Setup
- How Can Goldiraguide Help You Act on This Outlook?
- Frequently Asked Questions About the 2026 Gold Outlook
- Sources
Gold Price Outlook 2026: Where Prices Stand Right Now
Gold has already lived through one of its wildest years on record. The LBMA Gold Price PM two-year average sat near $3,520 per ounce as of late June 2026, but that smooths over a much rougher ride underneath.
Gold swung significantly in price over less than five months during 2026. Spot prices touched an intraday high above $5,500 in late January, then dropped substantially to an intraday low near $3,959 by late June, according to World Gold Council data.
That swing wasn't random noise. It tracked shifting expectations around Fed policy, a stronger dollar in the spring, and a wave of profit-taking after gold's record run into January. A few threads have defined the tape since:
- January's spike came on aggressive positioning ahead of anticipated rate cuts, pulling in momentum traders and ETF buyers at once
- The mid-year pullback coincided with hawkish Fed commentary that pushed real yields higher and cooled speculative demand
- Central banks kept buying through the correction, providing a demand floor even as Western ETF flows turned choppy
- Asian demand, particularly net imports out of China, held up support during U.S. trading hours when Western selling pressured the tape
The takeaway for anyone tracking the 2026 gold price prediction landscape: the metal is not moving on a single storyline. It's reacting to a tug-of-war between structural buyers (central banks, Asian retail) and macro-sensitive flows (ETFs, futures speculation) that shift with every Fed headline.
What Are Analysts Forecasting for Gold in 2026?
There is no single number here, and pretending otherwise would do investors a disservice. What exists is a wide band of institutional targets that cluster around the mid-$4,000s but stretch from bearish to aggressively bullish depending on which Fed path an analyst assumes.
The World Gold Council's mid-year survey put the average year-end forecast near $4,604 an ounce, with individual estimates ranging from about $4,872 to $5,800 on the high side and dipping to roughly $3,450 among the more conservative shops. That's a spread of more than $2,000 an ounce among professional forecasters, which tells you how much this outlook still hinges on unresolved macro questions.
| Institution | 2026 Target/Range | Key Rationale |
|---|---|---|
| World Gold Council / LBMA survey | ~$4,604 average ($3,450–$5,800 range) | Blends central bank demand, Fed path uncertainty, and ETF flow variability |
| J.P. Morgan | Up to around $6,000 by year-end in bullish scenarios | Aggressive rate-cut catalysts and continued reserve diversification, tempered by technical resistance |
| Wells Fargo | ~$4,900–$5,100 year-end | Favorable structural outlook, but flags downside to ~$3,500 in a stress scenario per Kitco reporting |
| Goldman Sachs | Fed-dependent, no fixed point target | Frames Fed policy as the primary variable tying gold's path to CPI and employment data |
Why the gap between $3,450 and $6,000? Three things explain most of it:
- Fed trajectory assumptions. Bulls assume multiple 2026 rate cuts; bears assume the Fed holds firm longer than markets expect.
- Geopolitical catalyst timing. A major shock (conflict escalation, sanctions, currency crisis) pulls forecasts higher fast; a quiet year pulls them lower.
- Central bank demand persistence. Analysts who expect reserve diversification to continue at recent pace lean bullish; those who expect it to taper lean toward the middle of the range.
HSBC and several other banks trimmed their 2026 targets mid-year specifically because the Fed sounded more hawkish than markets had priced in, which is the clearest real-world example of how fast this consensus can move.
What Macro Forces Actually Move Gold Prices?
Every gold price forecast worth reading traces back to five variables. Understanding how each one transmits into price action is what separates useful analysis from noise-chasing.
- Fed policy and real yields. Gold pays no interest, so it competes directly with yield-bearing assets. When the Fed's own projections point toward lower real rates, gold's opportunity cost drops and demand rises. When the dot plot shifts hawkish, the opposite happens fast.
- The dollar. Gold is priced in dollars globally, so a stronger greenback makes gold more expensive for non-U.S. buyers and typically pressures XAU/USD lower, all else equal.
- Inflation and employment data. CPI and PCE prints shape rate-cut odds directly. A hot jobs report that delays cuts tends to hit gold; a soft one tends to lift it.
- Central bank reserve diversification. Sustained buying from central banks, especially across Asia, has provided a demand floor that's structurally different from the speculative flows of past cycles.
- ETF flows and retail behavior. Institutional ETF flows can swing fast on macro headlines, while regional demand divergence in China and India often cushions the metal when Western flows turn negative.
Pro Tip: Watch the real yield on 10-year Treasury Inflation-Protected Securities (TIPS) alongside gold. When real yields fall while gold rises, that's confirmation the move is driven by genuine rate expectations, not just short-term speculation.
The mechanism worth remembering: gold rarely moves on one factor alone. The sharpest rallies and selloffs in 2026 came when two or more of these forces lined up in the same direction at once.
Bull, Bear, or Neutral: Which Gold Scenario Is Most Likely?
Rather than picking one number, it's more useful to think in scenarios with specific triggers attached. Here's how the year could plausibly break out:
- Bull case: $5,500–$6,500. Triggered by faster-than-expected Fed rate cuts, a fresh geopolitical shock, or an acceleration in central bank buying. J.P. Morgan's research flags this range as achievable if rate-cut catalysts materialize, though it would likely require clearing the technical resistance zone discussed below first.
- Base/neutral case: $4,400–$5,100. This is where most institutional targets cluster, assuming the Fed delivers a modest, well-telegraphed easing path and no major macro surprise hits. Expect a wide trading range within this band rather than a straight line in either direction.
- Bear case: $3,450–$3,900. Triggered by a hawkish Fed hold, a stronger-than-expected dollar rally, or a slowdown in central bank purchases. Wells Fargo's stress scenario lands in this zone.
A short watchlist to track which scenario is gaining ground:
- FOMC dot plot revisions and any change in the number of projected 2026 cuts
- Monthly CPI and nonfarm payrolls surprises relative to consensus
- Central bank gold purchase data from IMF reserve reports
- ETF flow direction (net creations vs. redemptions) on a weekly basis
What Technical Levels Are Traders Watching in 2026?
Gold's charts matter here almost as much as the macro story, because a resistance band near $4,500 to $4,900 has capped multiple rally attempts. That zone exists largely because investors who bought near January's record highs are sitting on losses or thin gains and tend to sell into strength as prices approach their entry points.
The 50-day moving average has traded in a $4,146 to $4,730 band through mid-2026, according to IG's technical analysis, making it the level short-term traders watch most closely for momentum confirmation.
- A sustained close above $4,900 on rising volume would signal the resistance zone is breaking, likely on a genuine rate-cut catalyst
- A drop below the 200-day moving average would suggest the correction has more room to run
- Rising implied volatility on gold options tends to precede sharp directional moves in either direction
Combining the two lenses matters: a bullish macro headline that fails to clear technical resistance often fades within days, while one that breaks through tends to extend.
What Should Investors Do With This Gold Outlook?
Translating a forecast into action starts with position sizing, not price prediction. Most financial planners suggest gold occupy somewhere between 5% and 15% of a diversified portfolio, scaling toward the higher end for investors prioritizing inflation protection or geopolitical hedging over growth.
Instrument choice matters as much as allocation size:
- Physical gold offers direct ownership with no counterparty risk, but storage and insurance add friction
- Gold ETFs provide liquidity and easy rebalancing, though they carry management fees and no physical delivery
- Futures offer leverage for tactical traders but carry margin and rollover risk unsuitable for most retirement portfolios
- Gold IRAs let retirement savers hold physical gold within a tax-advantaged structure, an option worth comparing against gold IRA pros and cons before committing capital
Timing tactics should tie back to the scenario triggers above rather than chasing headlines. Consider scaling into positions on pullbacks toward the $4,100 to $4,300 zone rather than chasing rallies above $4,900, and set a rebalancing trigger if gold's portfolio weight drifts more than a few percentage points from your target.
Pro Tip: Treat any single-day double-digit percentage move in gold as a signal to check your allocation, not a reason to panic-trade. The metal's 2026 volatility has punished reactive decisions far more than patient ones.
Risk controls that matter most: avoid over-concentrating in mining equities as a gold proxy (they carry operational risk gold itself doesn't), keep enough liquidity outside gold to avoid forced selling, and revisit your thesis quarterly against the Fed's updated projections rather than daily price swings.
What Do GoldIRAGuide's Ongoing Reports Show?
Goldiraguide tracks gold market conditions on a monthly cadence, monitoring dealer pricing, provider fee structures, and demand signals that don't always show up in institutional research notes.
- Recent monthly reviews show wider variation in dealer premiums during high-volatility stretches like January's rally, when spreads on physical bullion widened noticeably
- Zero-fee account structures among top-rated providers have become more competitive through 2026 as investor demand for transparent pricing increased alongside gold's volatility
That ground-level view, dealer behavior, fee shifts, and provider responsiveness, complements the macro forecasts above and often signals where retail sentiment is heading before it shows up in ETF flow data.
Will New Mining Technology Change Gold Supply in 2026?
Supply-side dynamics rarely dominate gold headlines the way Fed policy does, but they shape the floor under prices over a multi-year horizon. Mine production growth has been sluggish for over a decade, and 2026 hasn't changed that fundamentally.
Automation and AI-assisted ore-grade sensing are helping some large-scale mining operations improve extraction efficiency at existing sites, which modestly increases output without new discoveries. Deeper deposits that were uneconomical a decade ago are becoming viable as extraction technology improves, but permitting timelines and environmental reviews still stretch project timelines by years in most jurisdictions.

Recycled gold, primarily from scrapped jewelry and electronics, continues to supply roughly a third of annual gold supply globally, and that share tends to rise when prices spike, as it did after January's record run. Higher prices pull more scrap gold into the market, which acts as a natural, if modest, supply valve during rallies.
None of this changes the 2026 outlook dramatically. Supply growth remains structurally slow regardless of technological improvement, which means demand-side forces, central bank buying, ETF flows, and investor positioning, will keep driving short-term price action far more than anything happening at the mine level. For investors, the practical implication is simple: don't expect a supply shock to solve gold's volatility problem this year. The forces described in the drivers section above will keep doing the heavy lifting.
How Does Gold Compare to Other Safe-Haven Assets in 2026?
Gold isn't the only asset investors turn to when markets get shaky, but it occupies a distinct spot in the safe-haven lineup. Treasury bonds offer income and government backing, but their value moves inversely with interest rates, meaning they can lose ground in the same environment where inflation concerns push investors toward gold.
The dollar itself functions as a safe haven during global stress, but a hawkish Fed that strengthens the dollar typically works against gold prices simultaneously, creating tension between the two. Cryptocurrency has been pitched as digital gold by some investors, but its volatility has generally run several multiples higher than gold's, making it a poor substitute for investors seeking stability rather than speculative upside.
Real estate offers inflation protection too, but it's illiquid, carries financing costs sensitive to the same Fed policy driving gold's swings, and can't be sold in an afternoon if you need cash. Silver and other precious metals track gold loosely but with even higher volatility and thinner institutional demand support.
What gives gold its edge for 2026 specifically is the combination of central bank demand providing a structural floor, discussed in the drivers section, and the metal's historical tendency to hold value during exactly the kind of Fed policy uncertainty defining this year. That doesn't make gold risk-free. It moved more than $1,500 an ounce this year alone. But among the major alternatives, none combine gold's liquidity, its lack of counterparty risk, and its multi-century track record as a store of value during monetary uncertainty.
What Could Derail the 2026 Gold Outlook?
Every forecast in this piece assumes a range of plausible outcomes, not certainty. A handful of risks could push actual 2026 prices well outside any scenario band discussed above.
Geopolitical shocks top the list. An escalation in an active conflict zone, a major sanctions event, or a currency crisis in a large emerging economy could spike gold well past the bull case almost overnight, the way January's rally demonstrated when uncertainty peaked. These events are inherently unpredictable, which is exactly why gold holds appeal as a hedge against them in the first place.
A sharper-than-expected Fed pivot in either direction is the second major wildcard. If inflation data forces the Fed to hold rates higher for longer than markets currently price, gold could retest the bear case levels discussed earlier. Conversely, a sudden growth scare that forces emergency cuts could push gold toward or past the bull case fast.
Central bank demand could also shift unexpectedly. The buying pace from major reserve managers has been remarkably consistent for several years, but any signal of slowing purchases, whether from budget constraints or reserve rebalancing, would remove a key structural support discussed throughout this outlook.
Finally, a stronger-than-expected dollar rally driven by relative U.S. economic strength could pressure gold even in scenarios where other conditions look supportive. None of these risks are reasons to avoid gold entirely. They're reasons to size positions with the volatility already seen this year firmly in mind.
A Practical Read on Gold's 2026 Setup
The macro case for gold in 2026 is stronger than the price chart alone suggests, but that doesn't mean every entry point makes sense. Central bank buying and structural reserve diversification give this market a floor that didn't exist as reliably a decade ago, and that's the piece I'd weight most heavily against short-term Fed noise.
Where I'd push back on the more excitable bull calls: chasing rallies above resistance without a confirmed macro catalyst has burned momentum traders repeatedly this year. Discipline beats conviction when volatility runs this high, and the data supports scaling in gradually over trying to time a single entry.
How Can Goldiraguide Help You Act on This Outlook?
Reading a forecast is one thing. Deciding what to actually do with your retirement savings is another, and that's where most investors get stuck between analyst targets and a real decision.
Goldiraguide built its matching process specifically for that gap. Instead of guessing which provider fits your situation, you get personalized matching based on your investment goals, paired with independent reviews of top-rated precious metals dealers and full transparency on fee structures, including zero-fee account options where they exist. If you're weighing whether a Gold IRA fits your retirement plan given the scenarios above, start with the Gold IRA pros and cons breakdown for an honest look at tradeoffs, or use the free Gold IRA guide to compare top providers side by side and request a no-obligation consultation to see how gold fits your specific allocation.
Frequently Asked Questions About the 2026 Gold Outlook
Can gold reach $10,000 an ounce in 2026?
No major institutional forecast currently supports a $10,000 target for 2026. The most bullish credible estimates from J.P. Morgan reach toward $6,000 under aggressive rate-cut and geopolitical catalyst assumptions, well short of $10,000.
Is 2026 a good year to invest in gold?
That depends on your goals and time horizon. Gold's structural demand drivers, central bank buying and reserve diversification, remain intact even amid short-term volatility, which supports a case for measured allocation rather than an all-or-nothing bet.
Will gold prices rise in 2026?
The base case among major forecasters points toward modest gains from current levels, with the direction hinging heavily on Fed rate-cut timing. A hawkish Fed could just as easily push prices toward the bear case discussed above.
What is driving gold price volatility in 2026?
Shifting Fed policy expectations, real yield swings, and profit-taking after January's record highs have driven most of 2026's price action, compounded by central bank buying that offsets softer ETF flows during pullbacks.
How much of my portfolio should be in gold for 2026?
Many financial planners suggest a 5% to 15% allocation range, with the higher end suited to investors prioritizing inflation protection or geopolitical hedging over growth potential.
This article is general information, not a substitute for advice from a qualified financial advisor. Consult a qualified financial professional about your own circumstances before acting on anything here.
Sources
- Gold Mid-Year Outlook 2026: Point break | World Gold Council
- Gold Price Predictions for 2026 and 2027 I J.P. Morgan Global Research
- Goldman Sachs gold forecast: expectations for 2026
- Wells Fargo reiterates positive outlook for precious metals, still sees gold at $4,900 in 2026 | Kitco News